Equipped with a highly dynamic business strategy and advanced project execution, AMD provides physicians and investors with a reliable competitive edge that flourishes in its market environment.

Economy
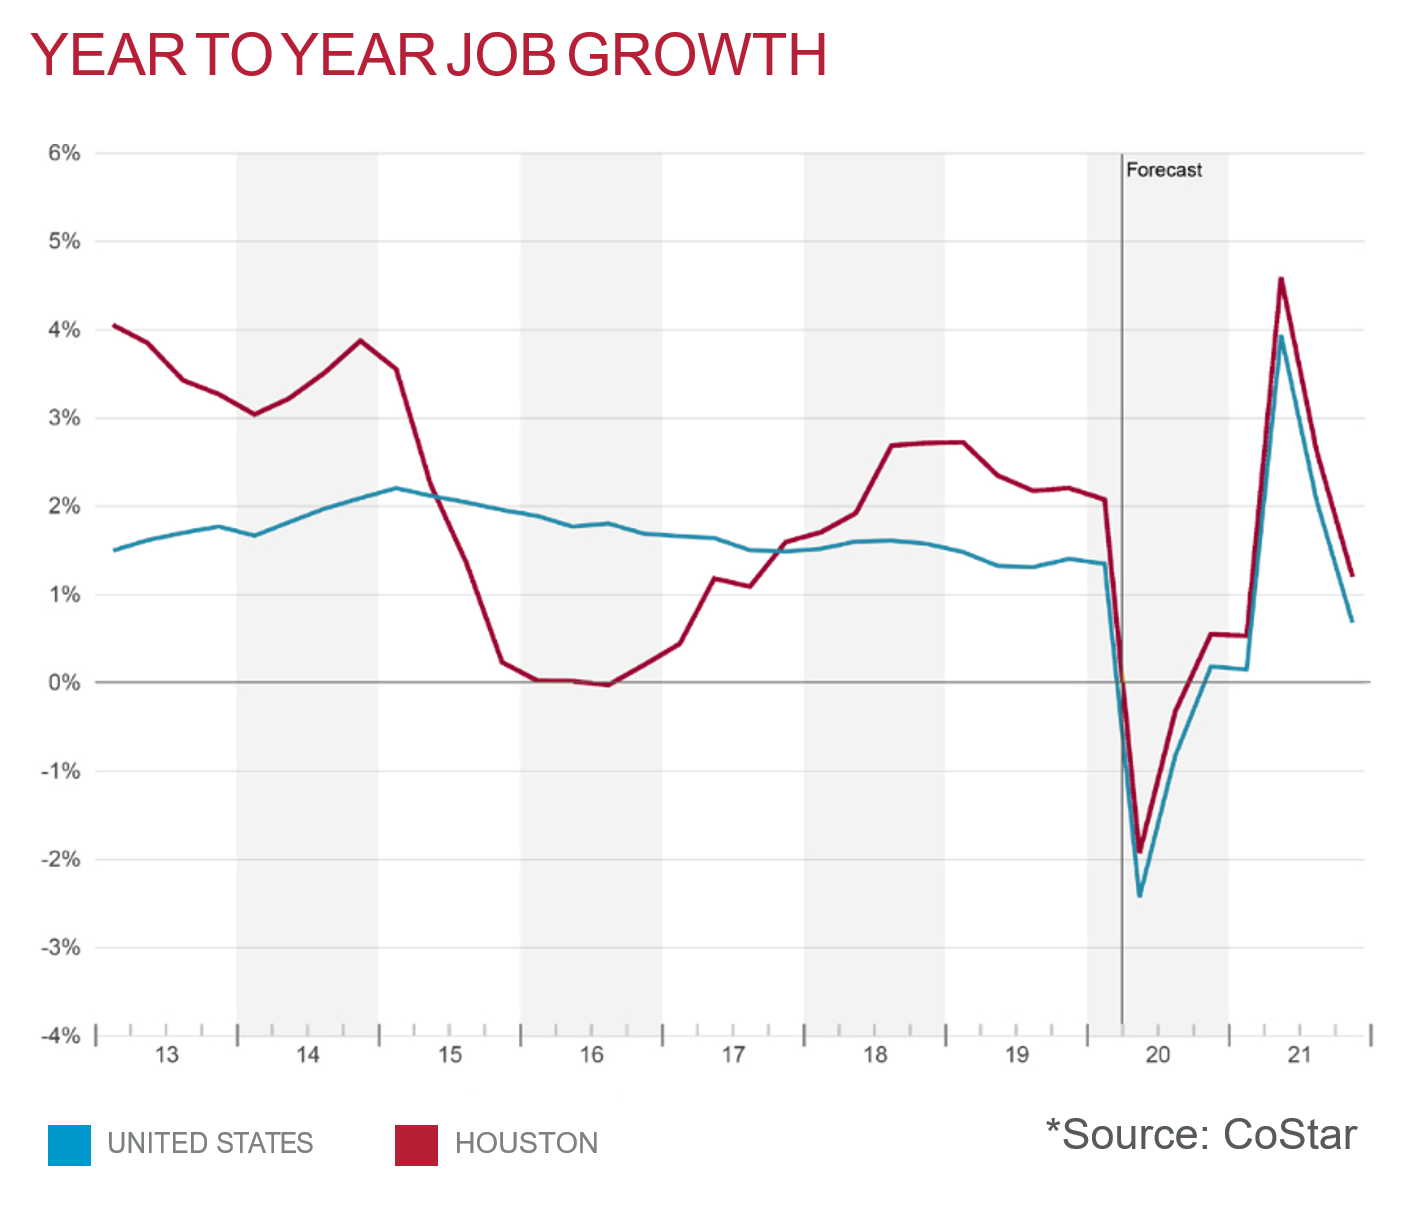
2020 began with cautious optimism as confidence in building on the conservative growth in 2019 were highlighted by several sizable office transactions during the first quarter. Broad demand has been bridled by uncertainty in the energy business combined with a long overdue capital market correction. That uncertainty became a new reality in early March as a global oil war sent an already weakened energy business into a mid-1980’s scale crash. Couple this with the COVID-19 health crisis that caused an economic shutdown of epic proportions and we find ourselves living a nightmare in which business sectors across the board have reverted to survival mode. Key economic indicators such as unemployment rates and GDP that looked promising at the beginning of the year are fluid at this point as the dismal results await. As the initial panic tails off, there are those that believe the economy will bounce back quickly due to the abrupt nature of the shutdown. No one knows for sure what looms ahead, but one thing is almost a guarantee: with its challenges related to the previous oil downturn, Houston will fall into a recession over the coming months.
According to industry experts, the US produces roughly 13M barrels of crude oil per day (bpd) and imports another 6M (bpd). The U.S. exports an average of 2-3M (bpd) while U.S. oil refineries have cut back to processing 15M (bpd) based on shrunken demand. The remainder is being stored in underground mines, storage tanks and tanker ships. With a total commercial crude oil storage capacity of nearly 650M barrels of storage and 450M already in inventory, the U.S. will reach maximum storage capacity in approximately 90-120 days. Oil companies will be shutting-in wells either voluntarily or involuntarily, the efficacy of which would be prolonged devastation to the industry and those that it supports.
| wdt_ID | Market Indicators | Q1 2020 (Current) | Q4 2019 | Q1 2019 |
|---|---|---|---|---|
| 1 | Vacancy Rate (%) | 16.8 ⬆︎ | 16.4 | 16.2 |
| 2 | Net Absorption (SF) | (1,590,062) | 1,637,955 | 425,790 |
| 3 | Quoted Rental Rate ($) | 28.46 ⬆︎ | 28.04 | 29.19 |
Source: CoStar
WTI Price
The WTI Crude Oil spot price for a barrel is averaged at $19-22 as of mid March. The average price was forecasted to increase to $54.31 for 2020 but is now predicted to be $38.19 because of economic turns due to COVID-19 (GHP).
Rig Count
As March 2020, drilling rigs working in the U.S. is at 792. This is down 225, or 22.87%, rigs from the same week in March last year (Baker Hughes).


Trending Now
The stay home, work safe order will at bring into question the necessity of large-scale office space and likely have long term impact on workplace culture. Social and economic trends that have been unfolding over the last several years will fully transpire as, for the first time ever, more people are working from home than from the office. Companies that are managing a remote workforce will be closely evaluating the effects of telecommuting during this global experiment. Without the conventional 9:00- 5:00 routine, work hours are becoming more flexible and professional etiquette such as refraining from after-hour emails has become less of a concern.
If productivity is not compromised, an increasing number of companies will turn away from the traditional model of commuting every day to a central headquarters. The silver lining is that employees that the require flexible working arrangements or desire an improved work – life balance are in for a significant change in the way business can occur remotely. The bad news is that the rest of us are as well.
Vacancy & Rental Rates
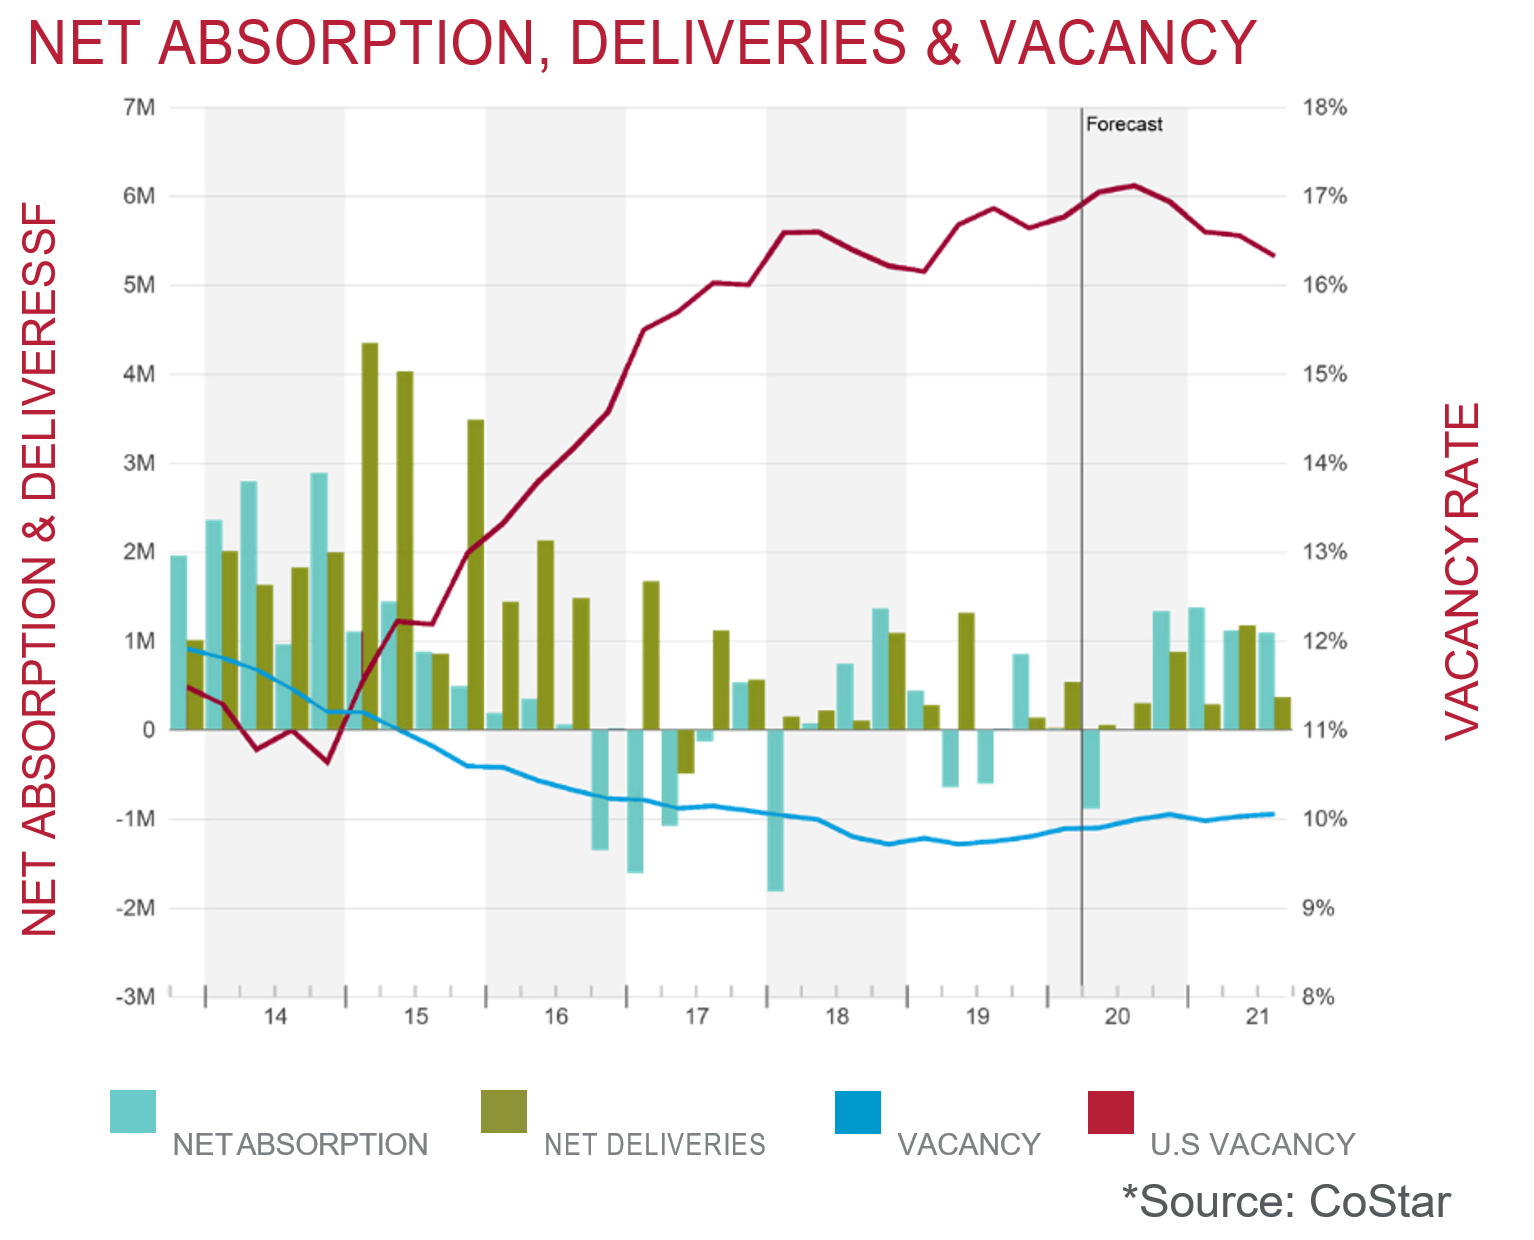
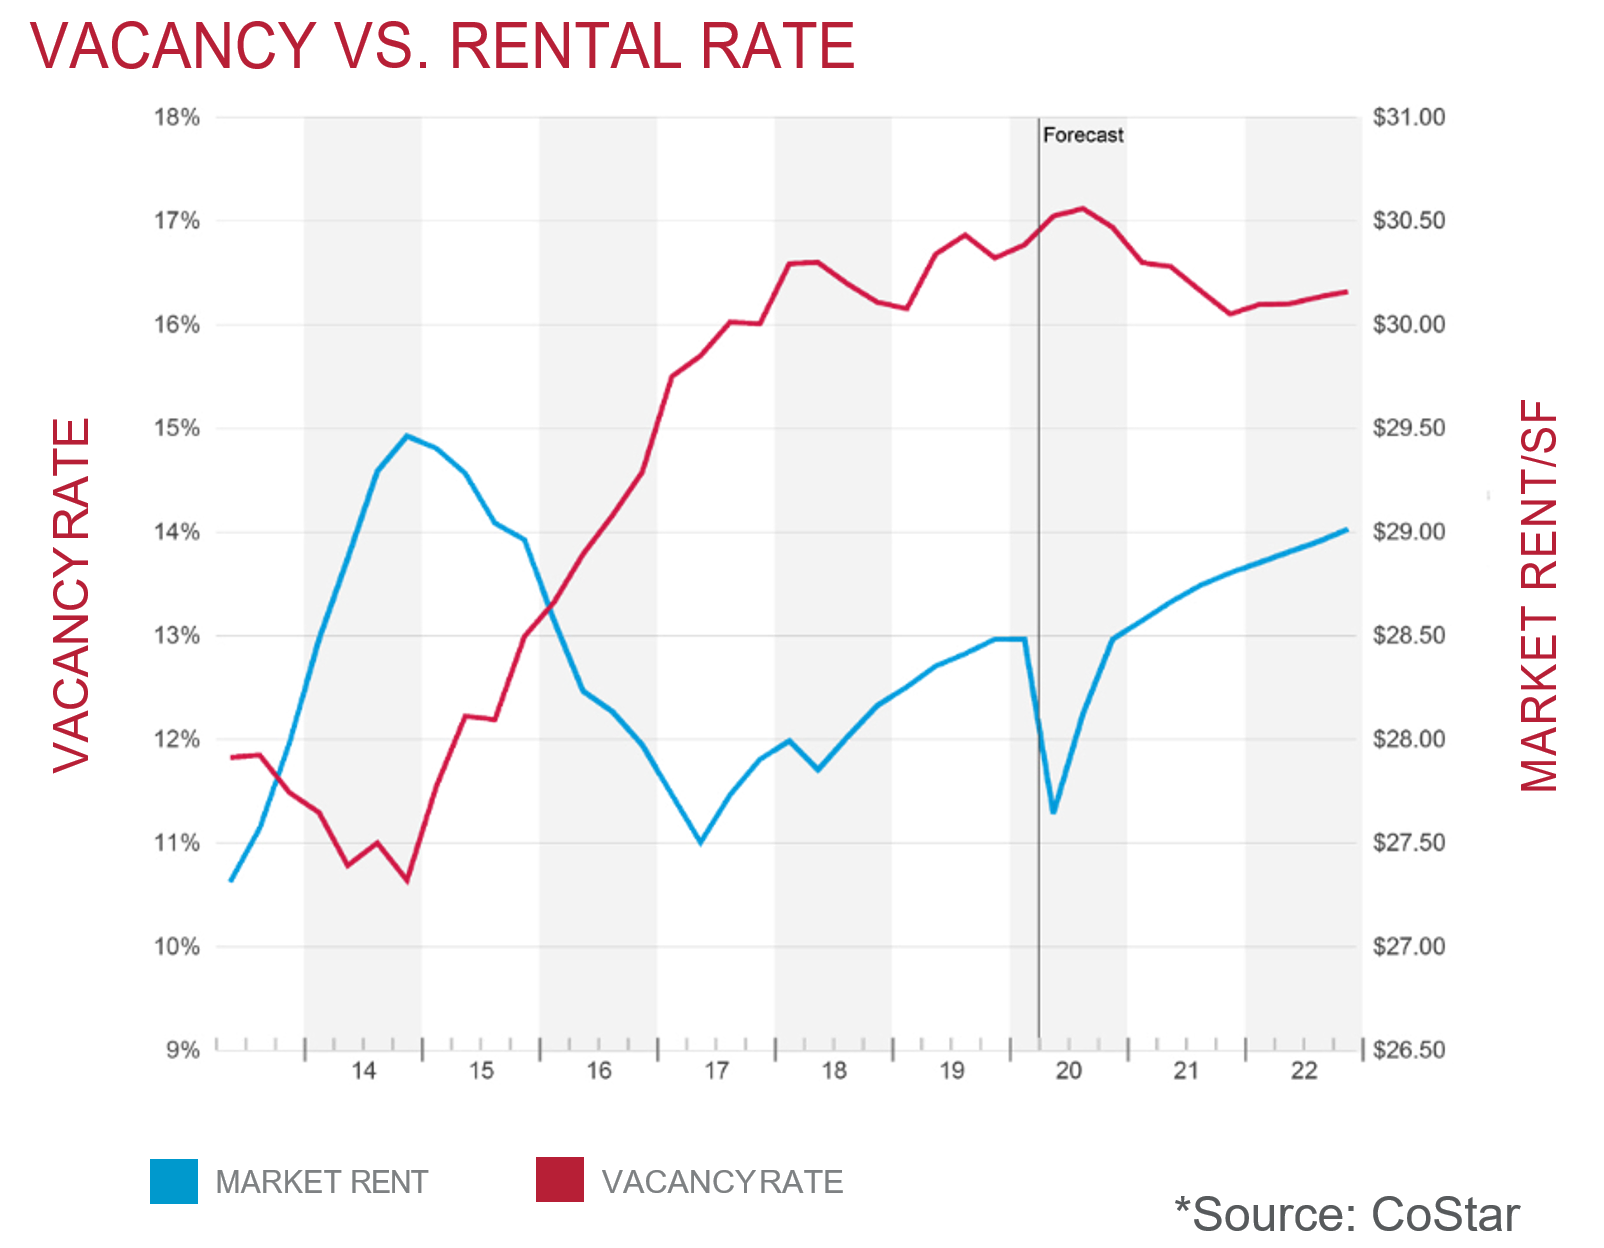
The office vacancy rate in the Houston market area continued to increase this quarter to 16.8%. This is up 0.4% from last quarter’s vacancy rate of 16.4% in Q4 2019. The struggling office market The vacancy rate was 16.6% at this time last year (CoStar). Overall, the North District/N Belt West submarket has the highest availability (Transwestern).
The average quoted asking rental rate for available office space, all classes, for this quarter has decreased slightly to $28.46 per square foot in comparison to $28.04 per square foot per year gross from last quarter. At this time last year, the rental rate was $29.19 in Q1 2019. Class A availability stands at 18.7% and Class B at 23.0% (Transwestern). However, rental rates are unlikely to increase market wide until more vacancy is absorbed throughout the market.


Data
Submarket Data
| wdt_ID | Submarket | Number of Buildings | Total RBA | Vacancy (SF) | Vacancy (%) | YTD Net Absorption | YTD Deliveries | Under Construction (SF) | Quoted Rates |
|---|---|---|---|---|---|---|---|---|---|
| 1 | Baytown | 140 | 1,901.00 | 102,761.00 | 5.40% | 5,206.00 | 0 | 53 | $22.22 |
| 2 | Bellaire | 92 | 5,237.00 | 709,361.00 | 13.50% | 78,274.00 | 1 | 1,252 | $25.53 |
| 3 | CBD | 160 | 51,212.00 | 10,261,678.00 | 20.00% | 66,327.00 | 1 | 169 | $37.19 |
| 4 | E Fort Bend Co/Sugar. | 433 | 10,125.00 | 1,114,148.00 | 11.00% | 14,697.00 | 21 | - | $27.56 |
| 5 | FM 1960/Champions | 263 | 4,420.00 | 788,784.00 | 17.80% | -212,429.00 | 0 | 148 | $19.13 |
| 6 | FM 1960/Hwy 249 | 465 | 9,631.00 | 1,557,197.00 | 16.20% | -263,317.00 | 24 | - | $25.59 |
| 7 | FM 1960/I-45 North | 113 | 2,511.00 | 755,455.00 | 30.10% | -230,572.00 | 0 | 70 | $20.48 |
| 8 | Galleria/Uptown | 66 | 16,850.00 | 2,911,681.00 | 17.30% | -253,579.00 | 0 | - | $31.21 |
| 9 | Greenspoint/IAH | 57 | 3,355.00 | 770,497.00 | 23.00% | 58,947.00 | 0 | - | $19.51 |
| 10 | Greenspoint/N Belt W. | 117 | 10,897.00 | 5,040,519.00 | 46.30% | -11,767.00 | 0 | - | $18.95 |
| Submarket | Number of Buildings | Total RBA | Vacancy (SF) | Vacancy (%) | YTD Net Absorption | YTD Deliveries | Under Construction (SF) | Quoted Rates |
Source: CoStar
Houston MOB Sale Transactions
| Property | Status | Price | Type | Size | Other Information |
|---|---|---|---|---|---|
| Property | Status | Price | Type | Size | Other Information |
Source: CoStar Group, CBRE
Houston Active Listings
| Address | Name | City | Price | Cap Rate | Area | $/SF |
|---|---|---|---|---|---|---|
| Address | Name | City | Price | Cap Rate | Area | $/SF |
Source: CoStar Group, CBRE
Source: CBRE
Source: COHGIS
